Gourmet delivery, from order to control room
Bneed wanted to bring high-end restaurants to home delivery without the experience feeling like fast food. I designed the customer app and the control-room dashboard that manages restaurants, couriers, stock and customers.
- My role
- UX/UI design, prototypes and client presentations
- Client
- Bneed · gourmet restaurant delivery
- Scope
- iOS/Android app and web dashboard
- Users
- Customers, control-room operators and restaurants
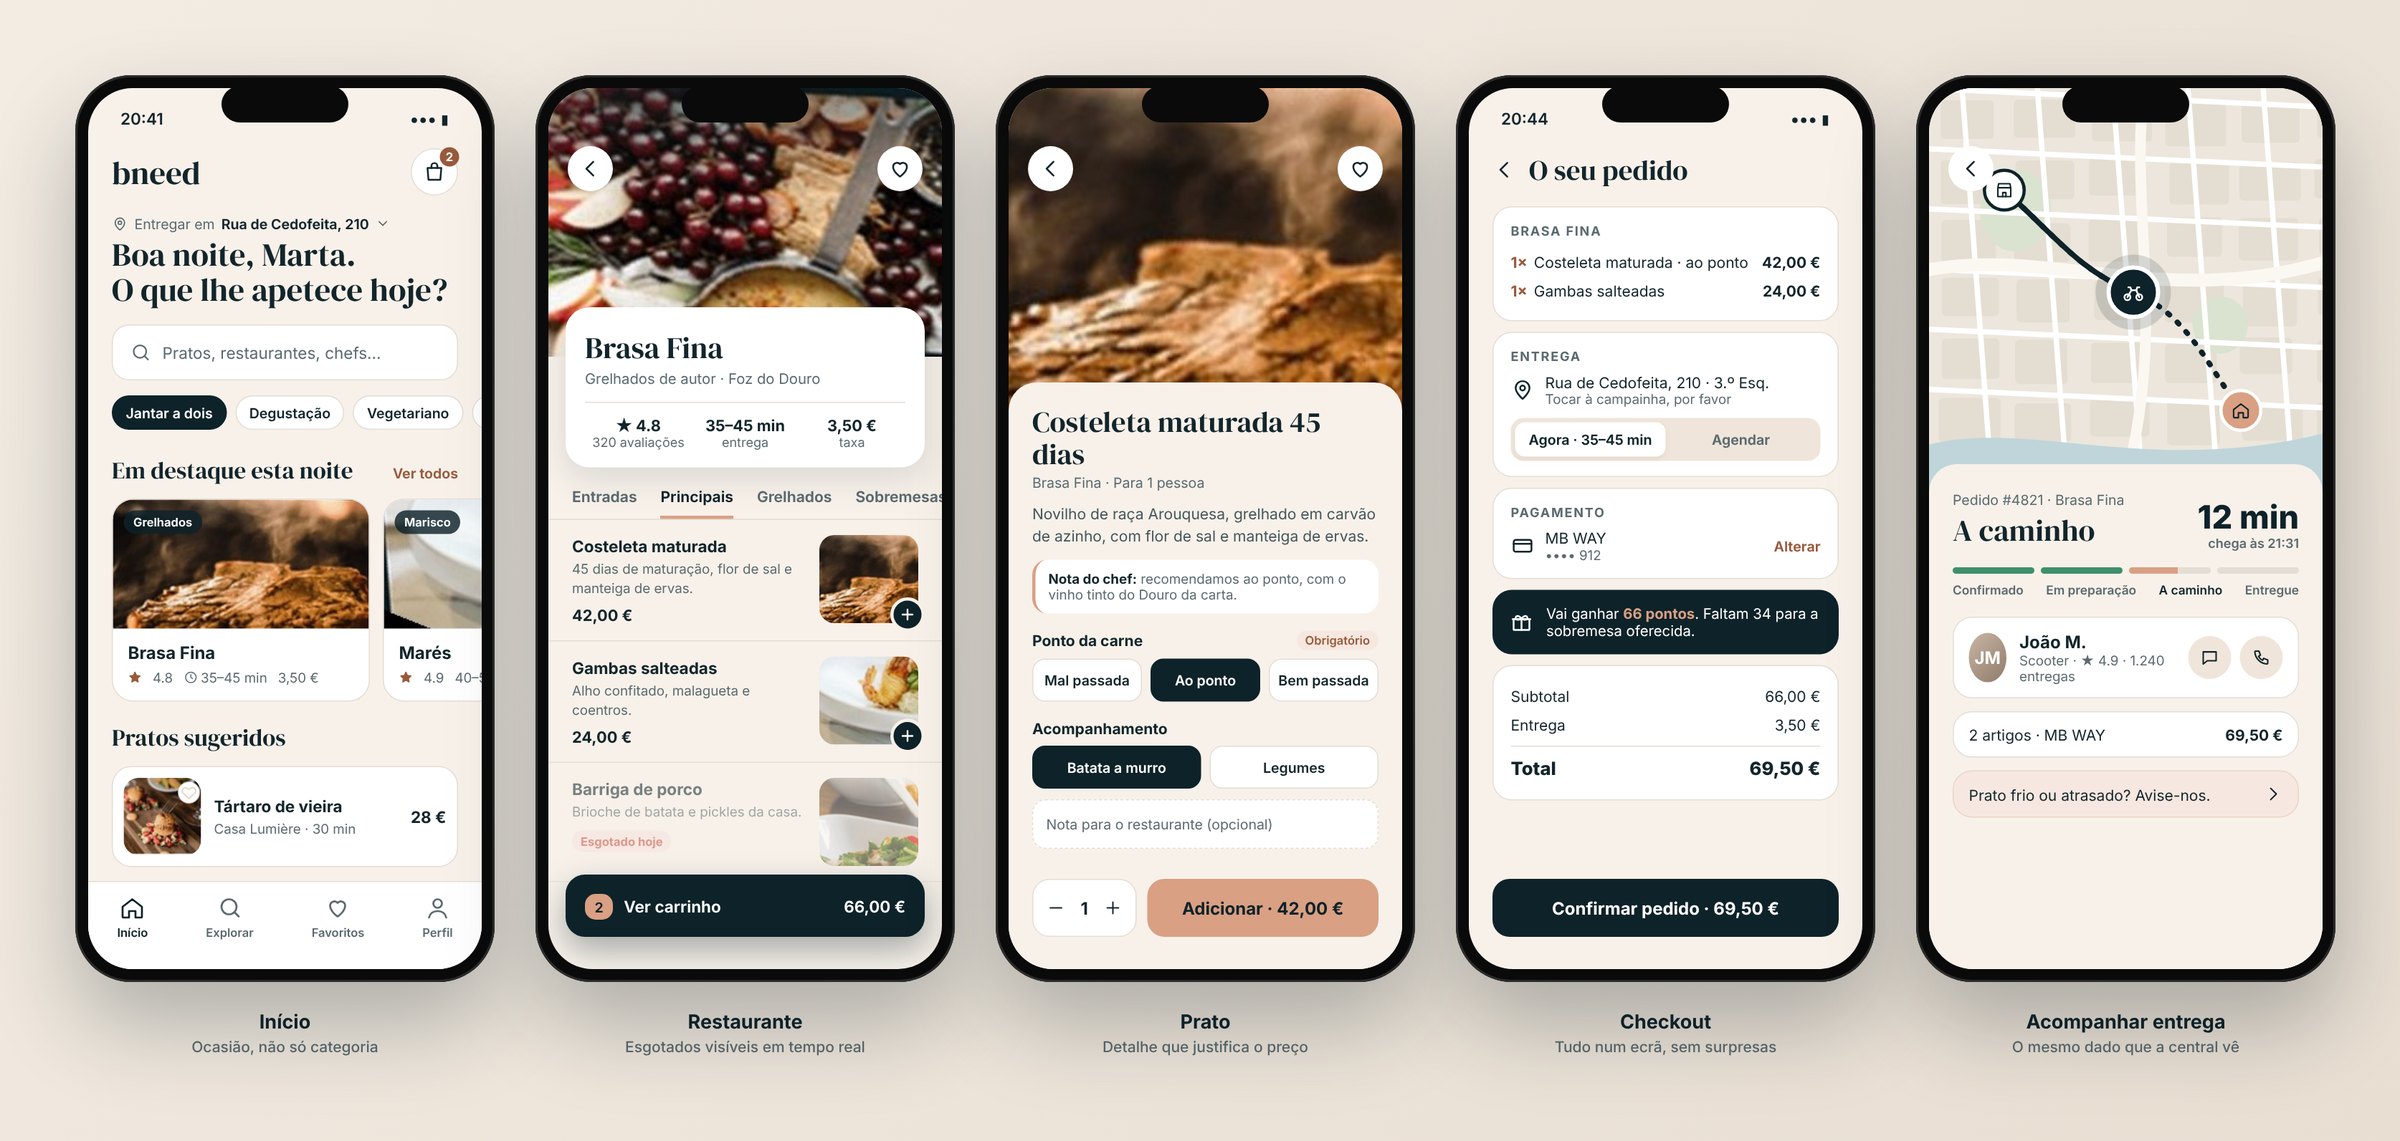
Bring several high-end restaurants into one app, with an experience worthy of the price, and run the whole operation behind it.
Two products connected by the same data: a simple app for customers and a dashboard that shows the control room only what needs action.
A complete order in 5 screens, and a control room that sees deliveries, couriers, stock and loyalty in one place.
Context
The best-known delivery apps are built for volume: long lists, promotions and small photos. For chef-led restaurants and €30–40 dishes, that undersells the product.
Bneed brought several of these restaurants together in one app. That created a second, less visible challenge: coordinating menus, stock, couriers and customers across many restaurants at once, from a central control room.
A restaurant experience, delivered at home, with simple flows for customers and full control for the operation.
Three users, one system
Before designing anything, I mapped who uses what and what information each of them needs. The key insight was that all three sides depend on the same data.
A single source of truth: when a dish sells out or a delivery runs late, the customer and the control room see the same thing at the same time.
App wireframes
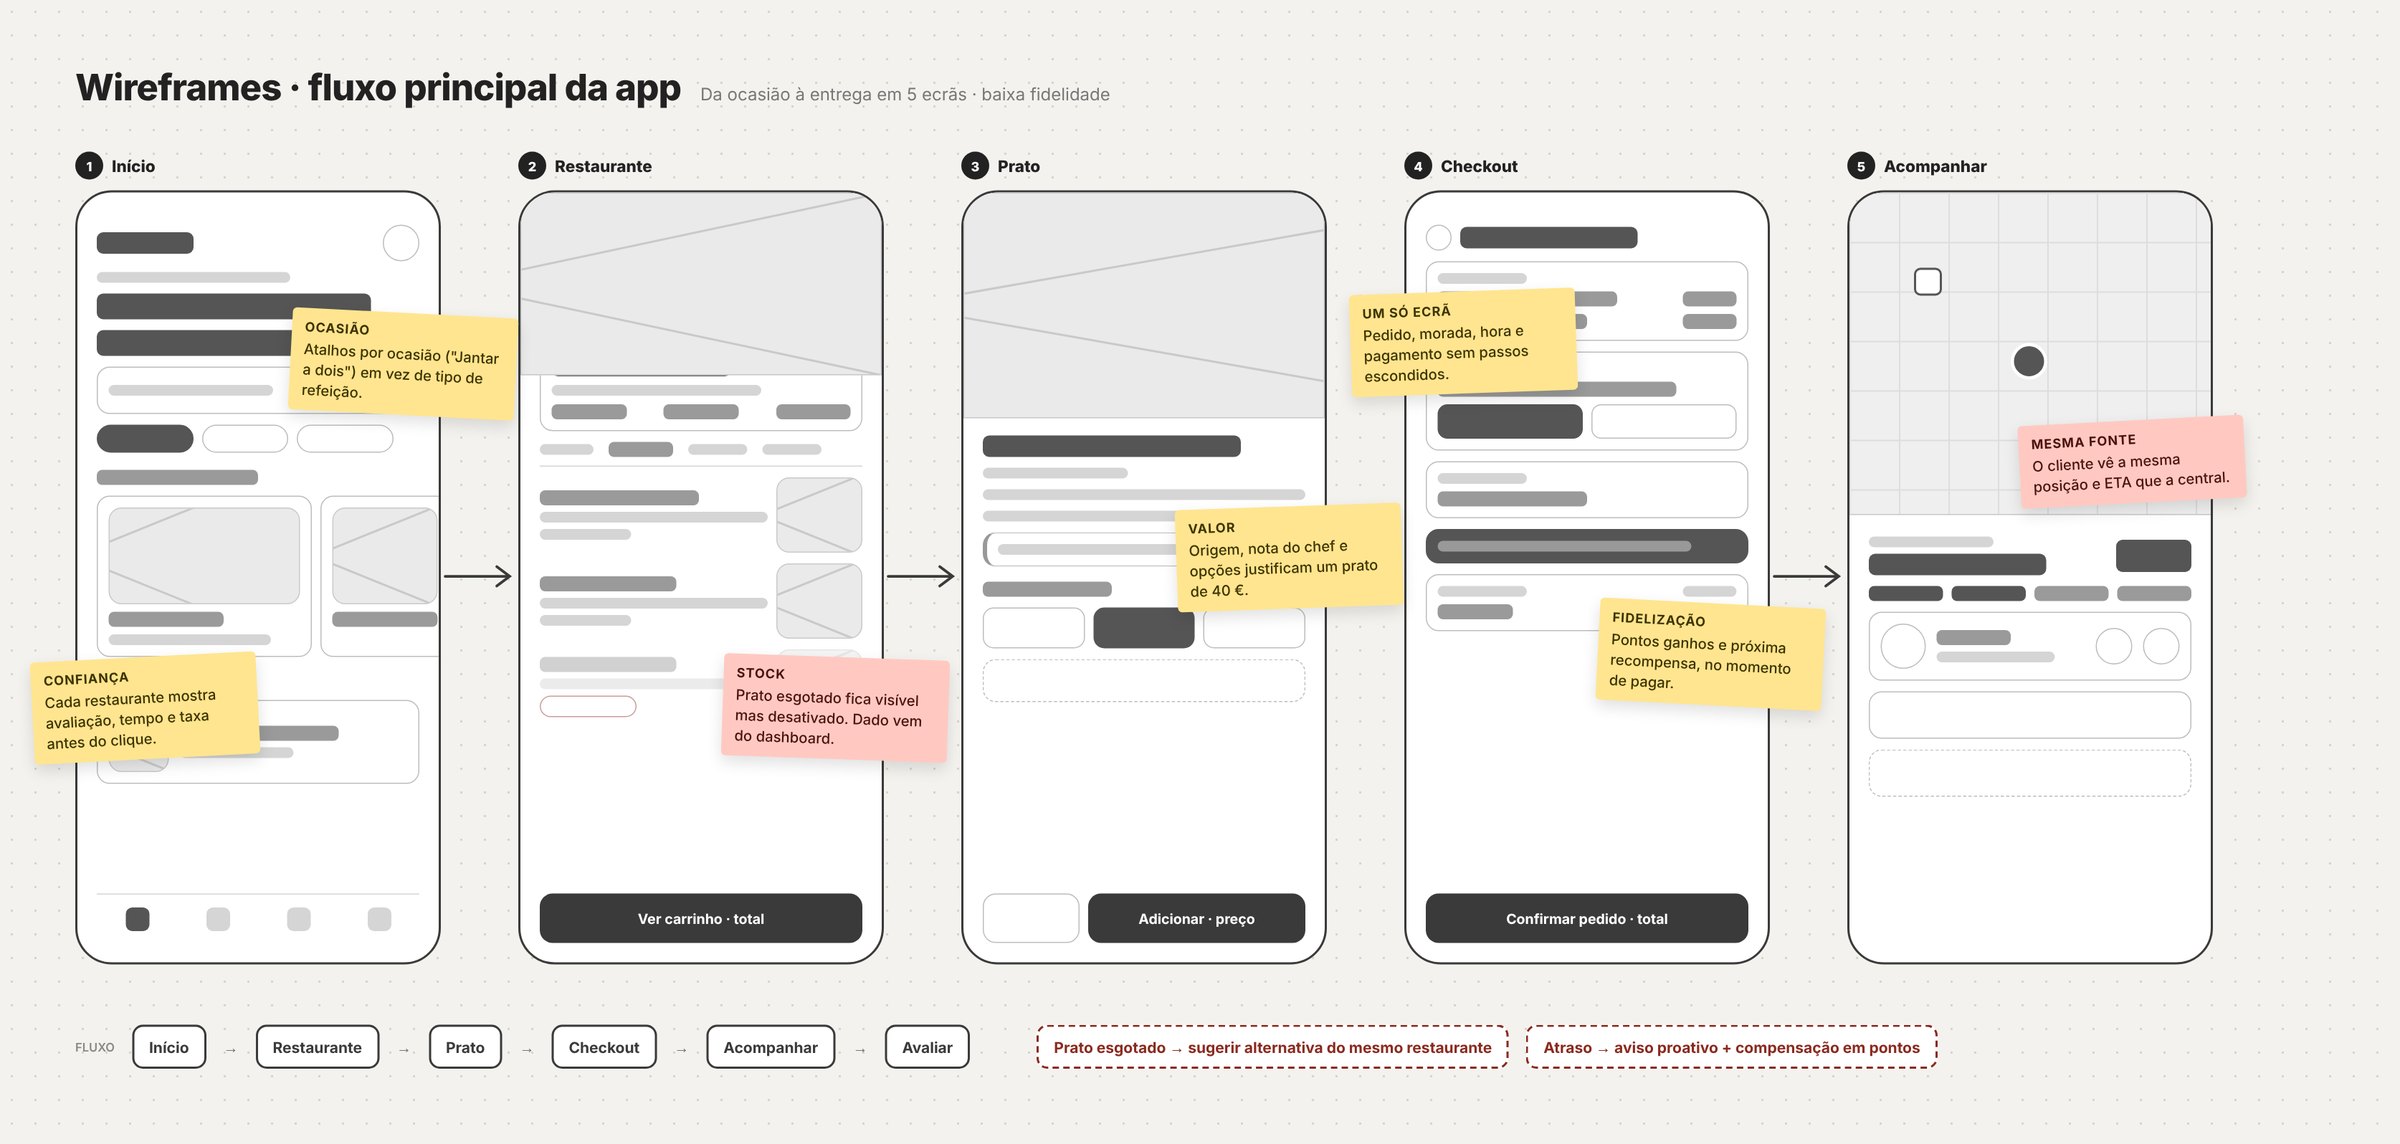
I started with the main flow, in low fidelity, to agree with the client on the order of the screens and what each one had to answer, before discussing colours and photos.
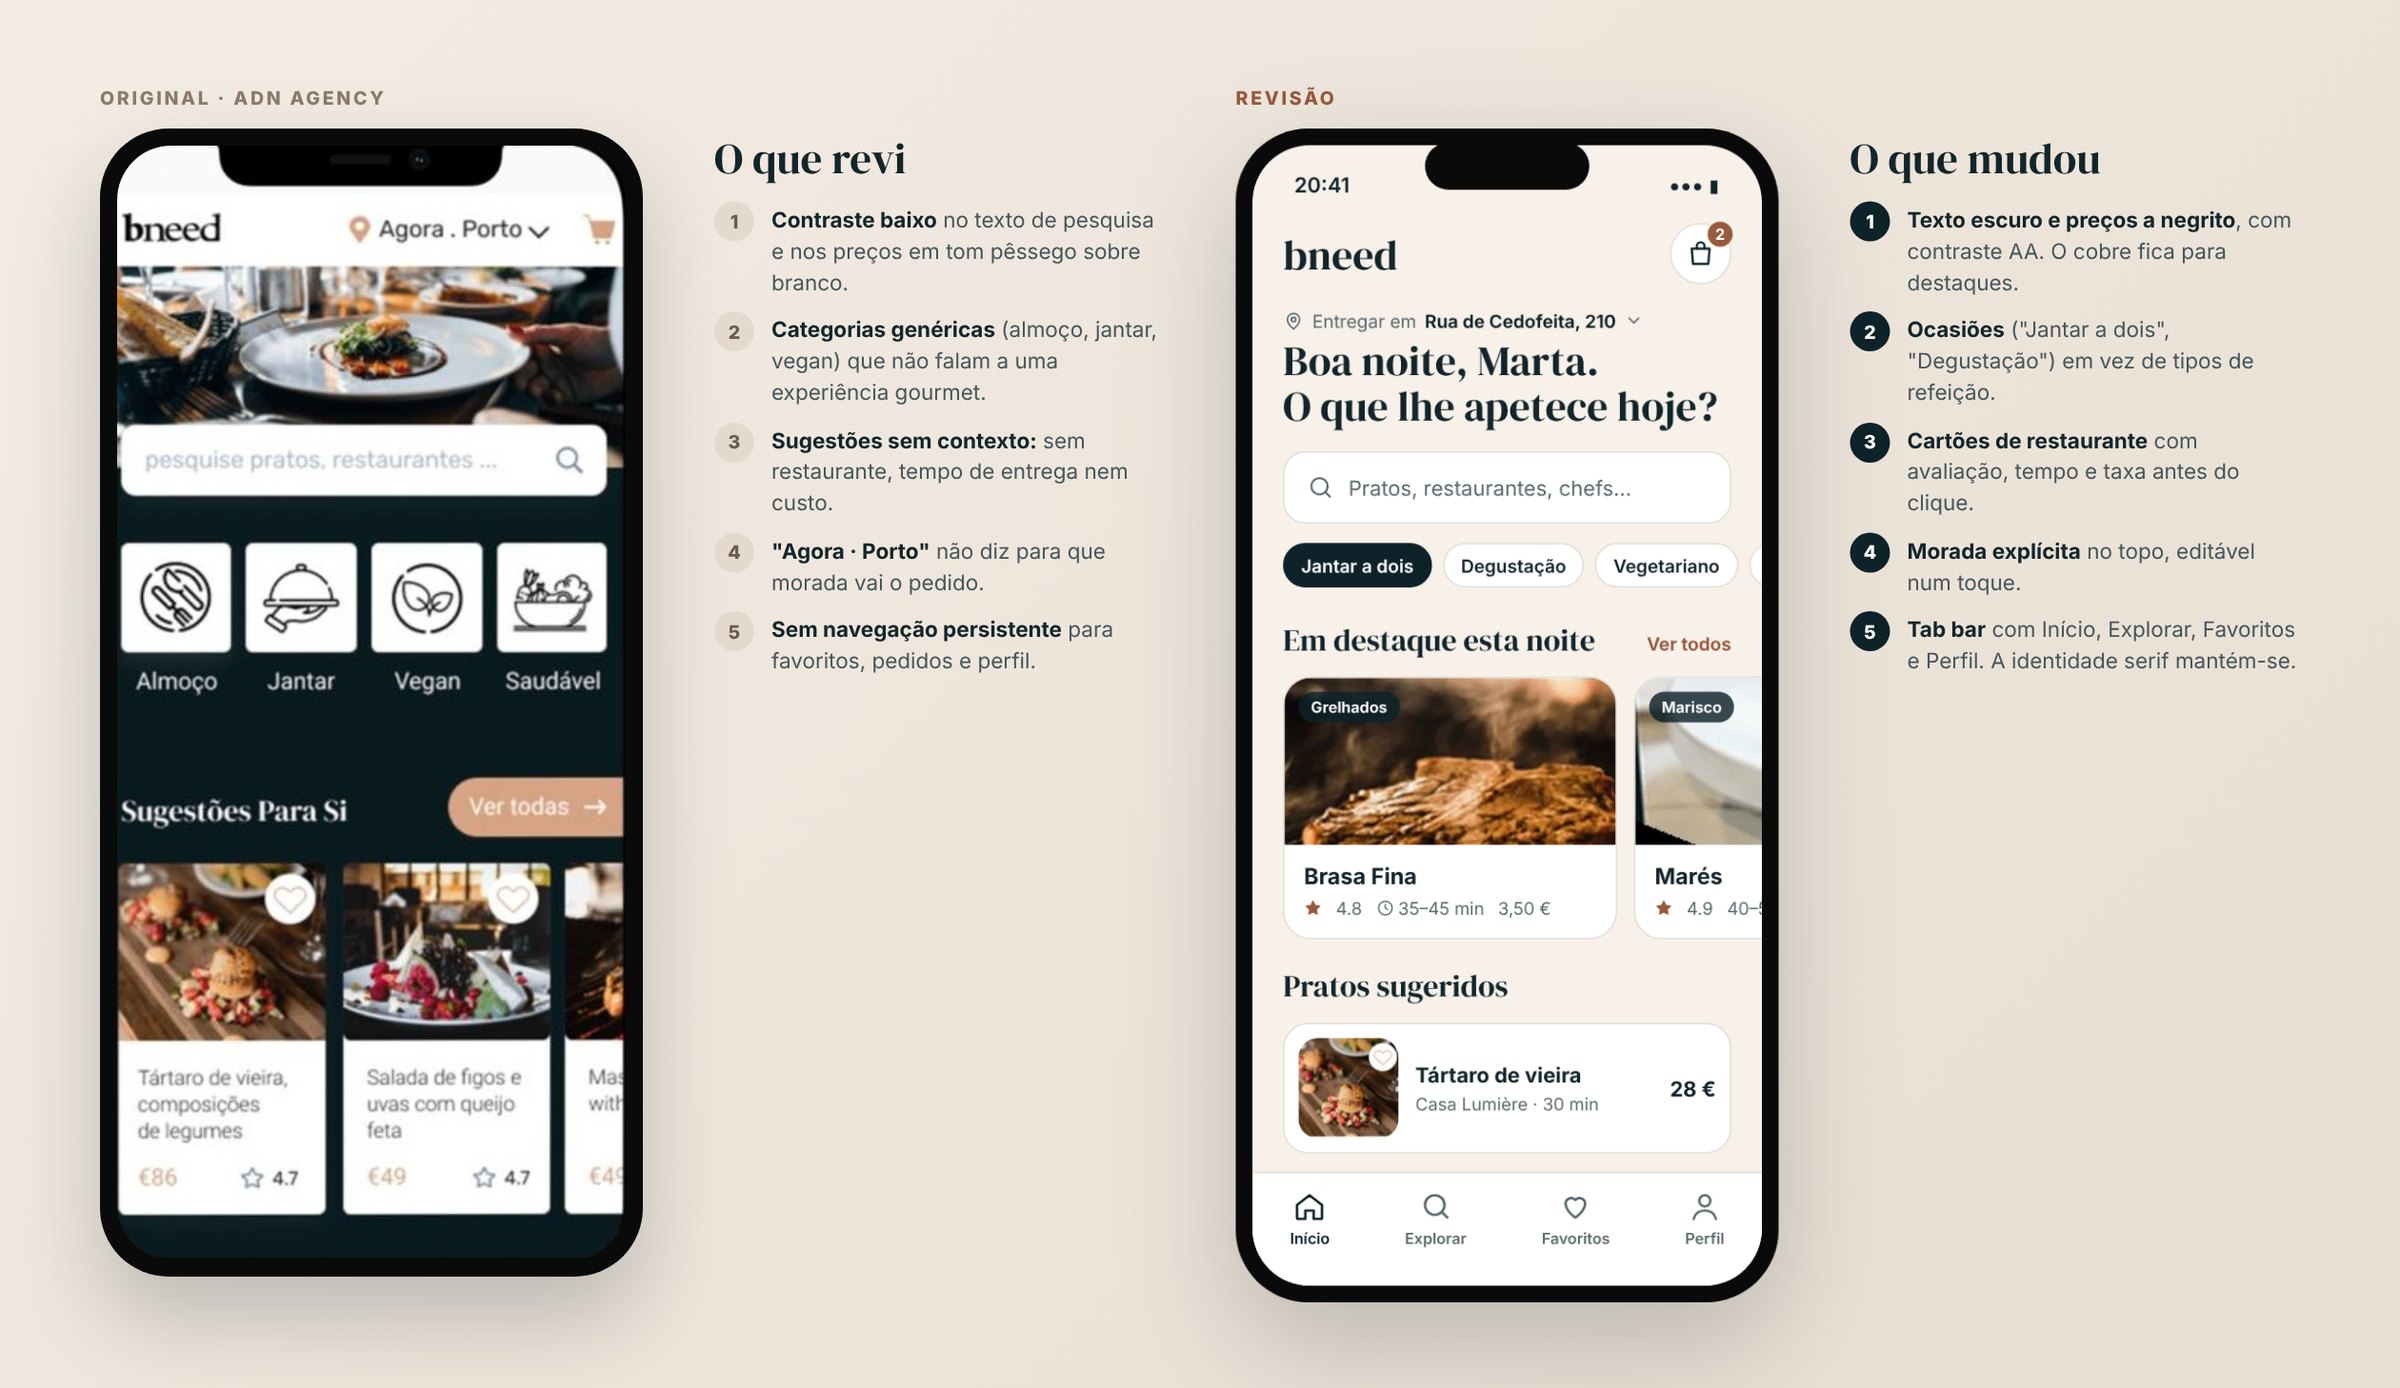
Final screens, revisited
I went back to the original screens with today's eye. I kept the identity (teal-navy, copper and serif headings) and fixed what I could no longer defend: contrast, context in the cards and navigation.
Occasion instead of category
"Dinner for two" or "Tasting menu" says more to someone looking for an experience than "Lunch" or "Vegan".
The dish sells through detail
Origin, a note from the chef and options (like how the meat is cooked) help justify the price and reduce order mistakes.
Sold out, but visible
A sold-out dish appears disabled instead of disappearing. The customer understands it's the same restaurant and that the dish will be back.
Loyalty at the right moment
Points and the next reward appear at checkout, right when the purchase decision is being made.
Control-room dashboard
The dashboard tracked every delivery and every courier, customers and loyalty, restaurants, sold-out dishes and delays. With that much information, the design question was: what does the operator need to see in 5 seconds?
I organised the main screen around four questions, in order of urgency. Each zone of the screen answers one of them.
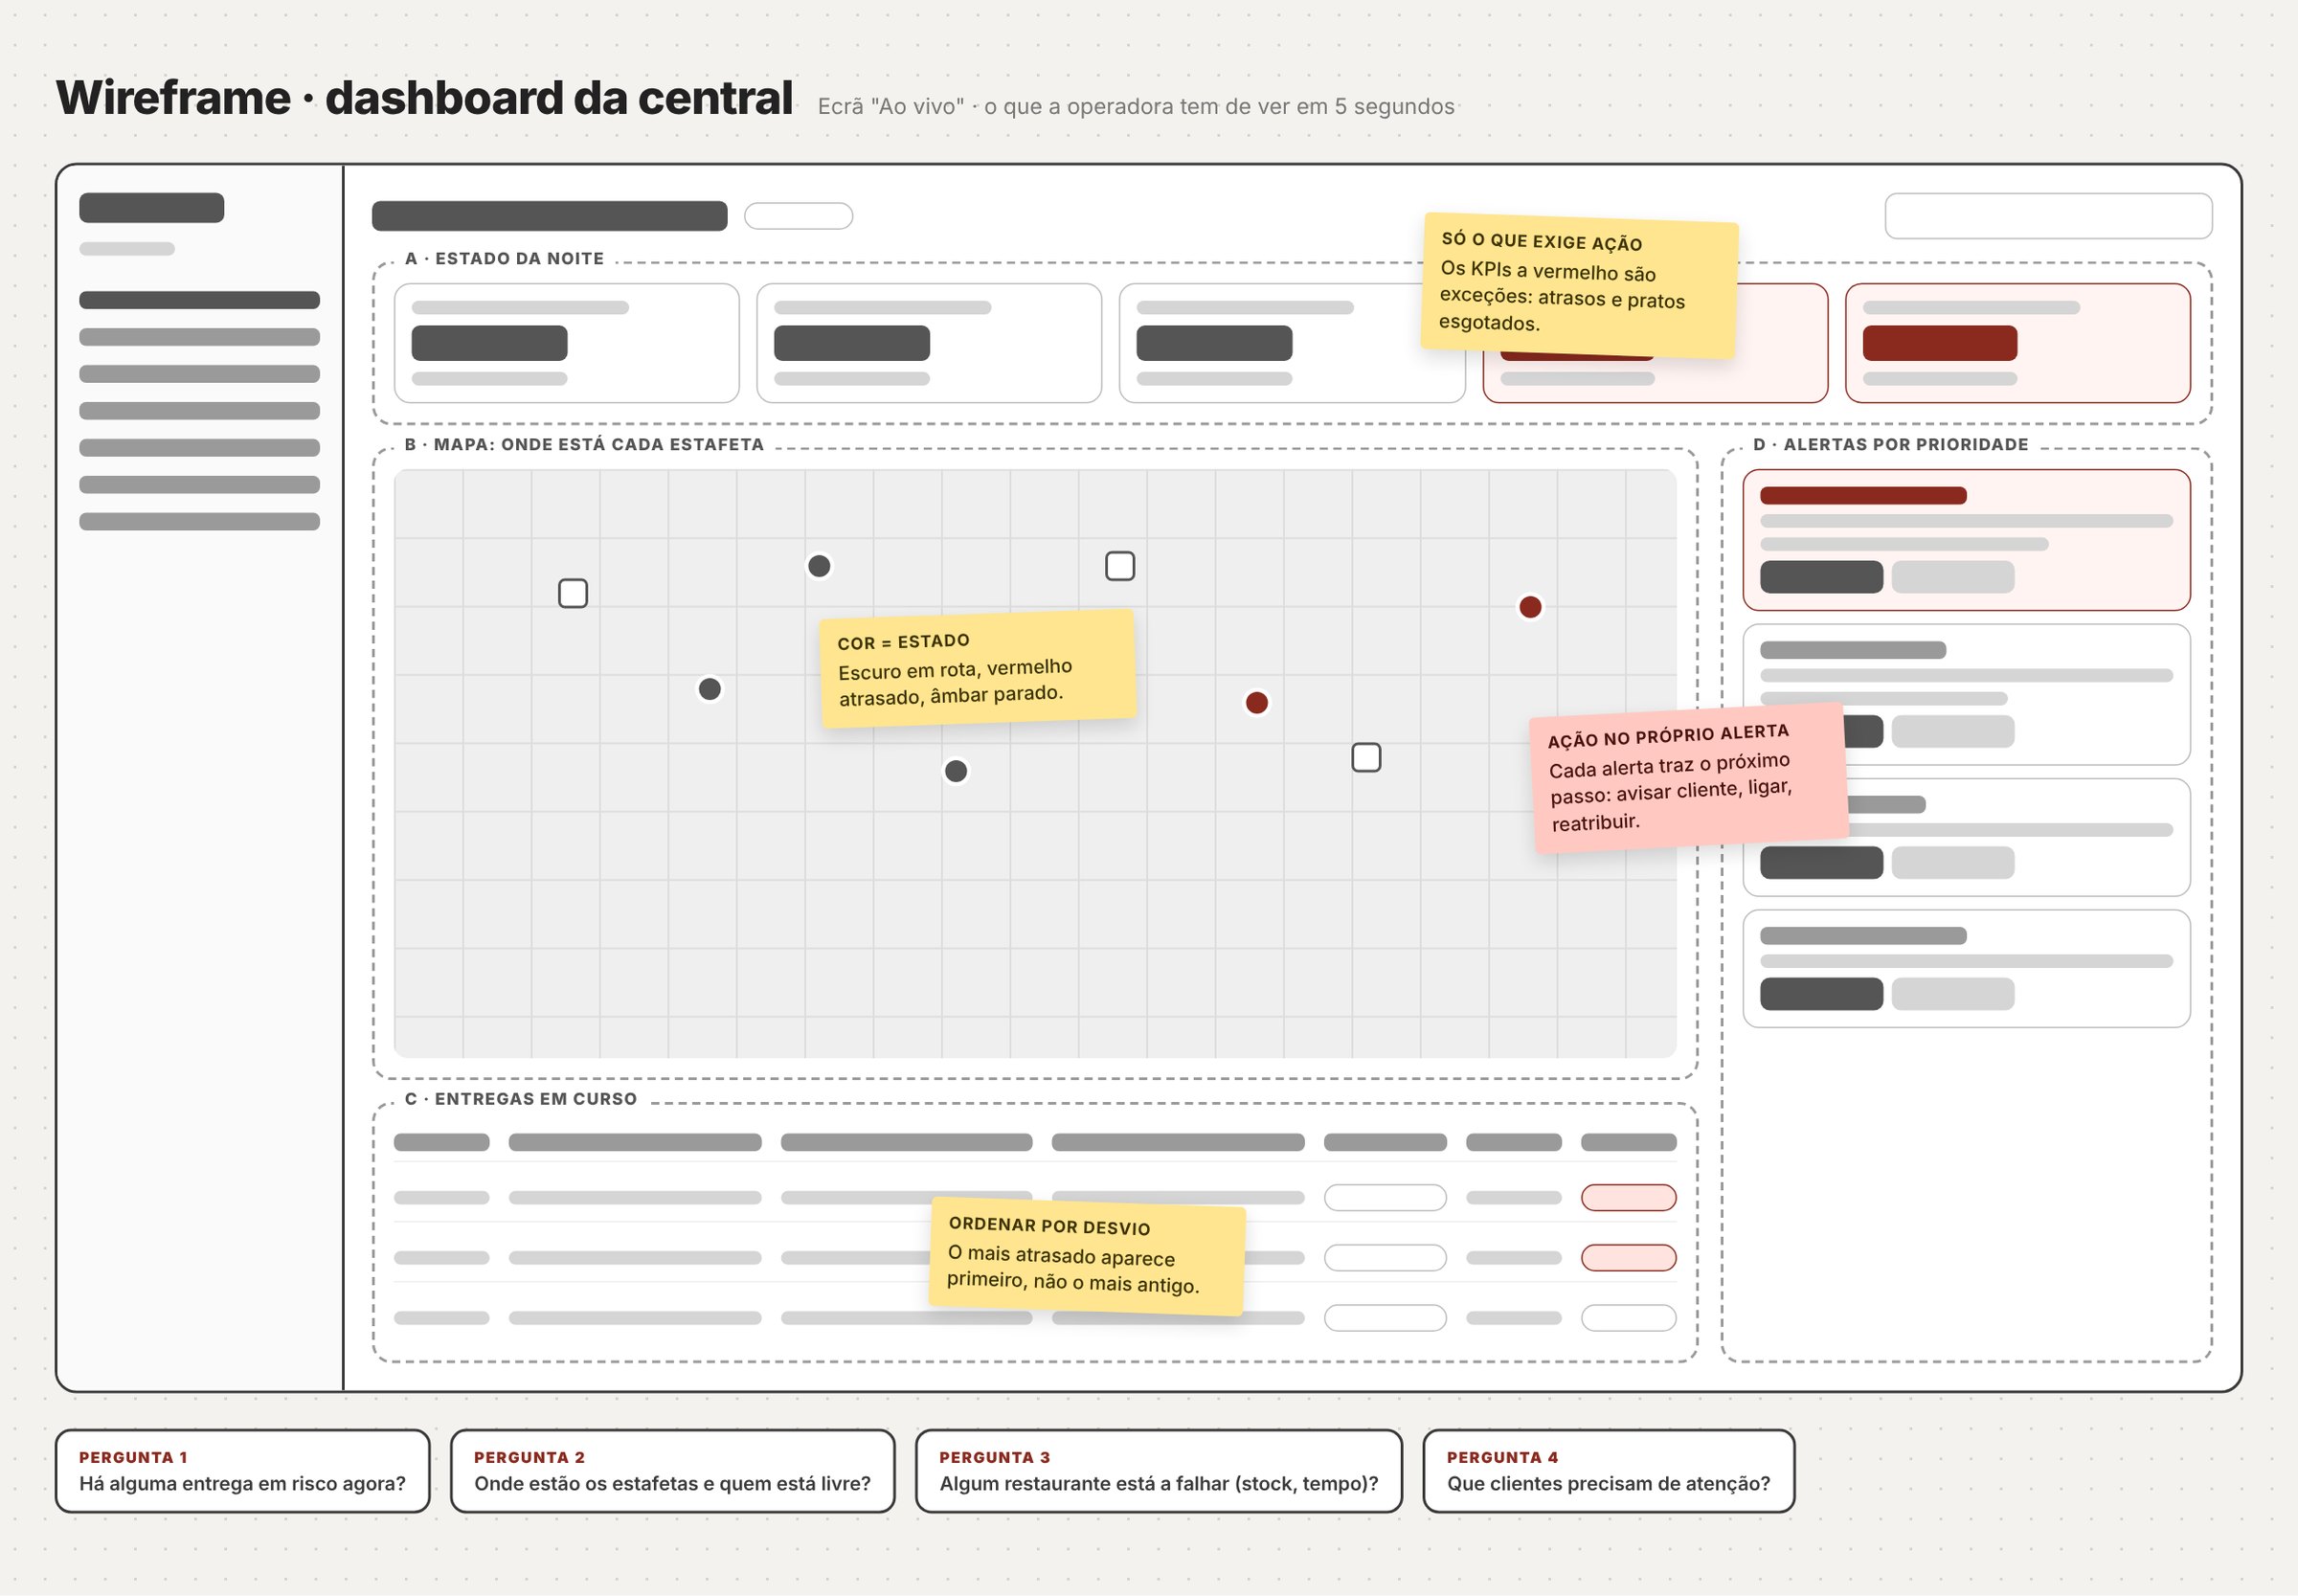
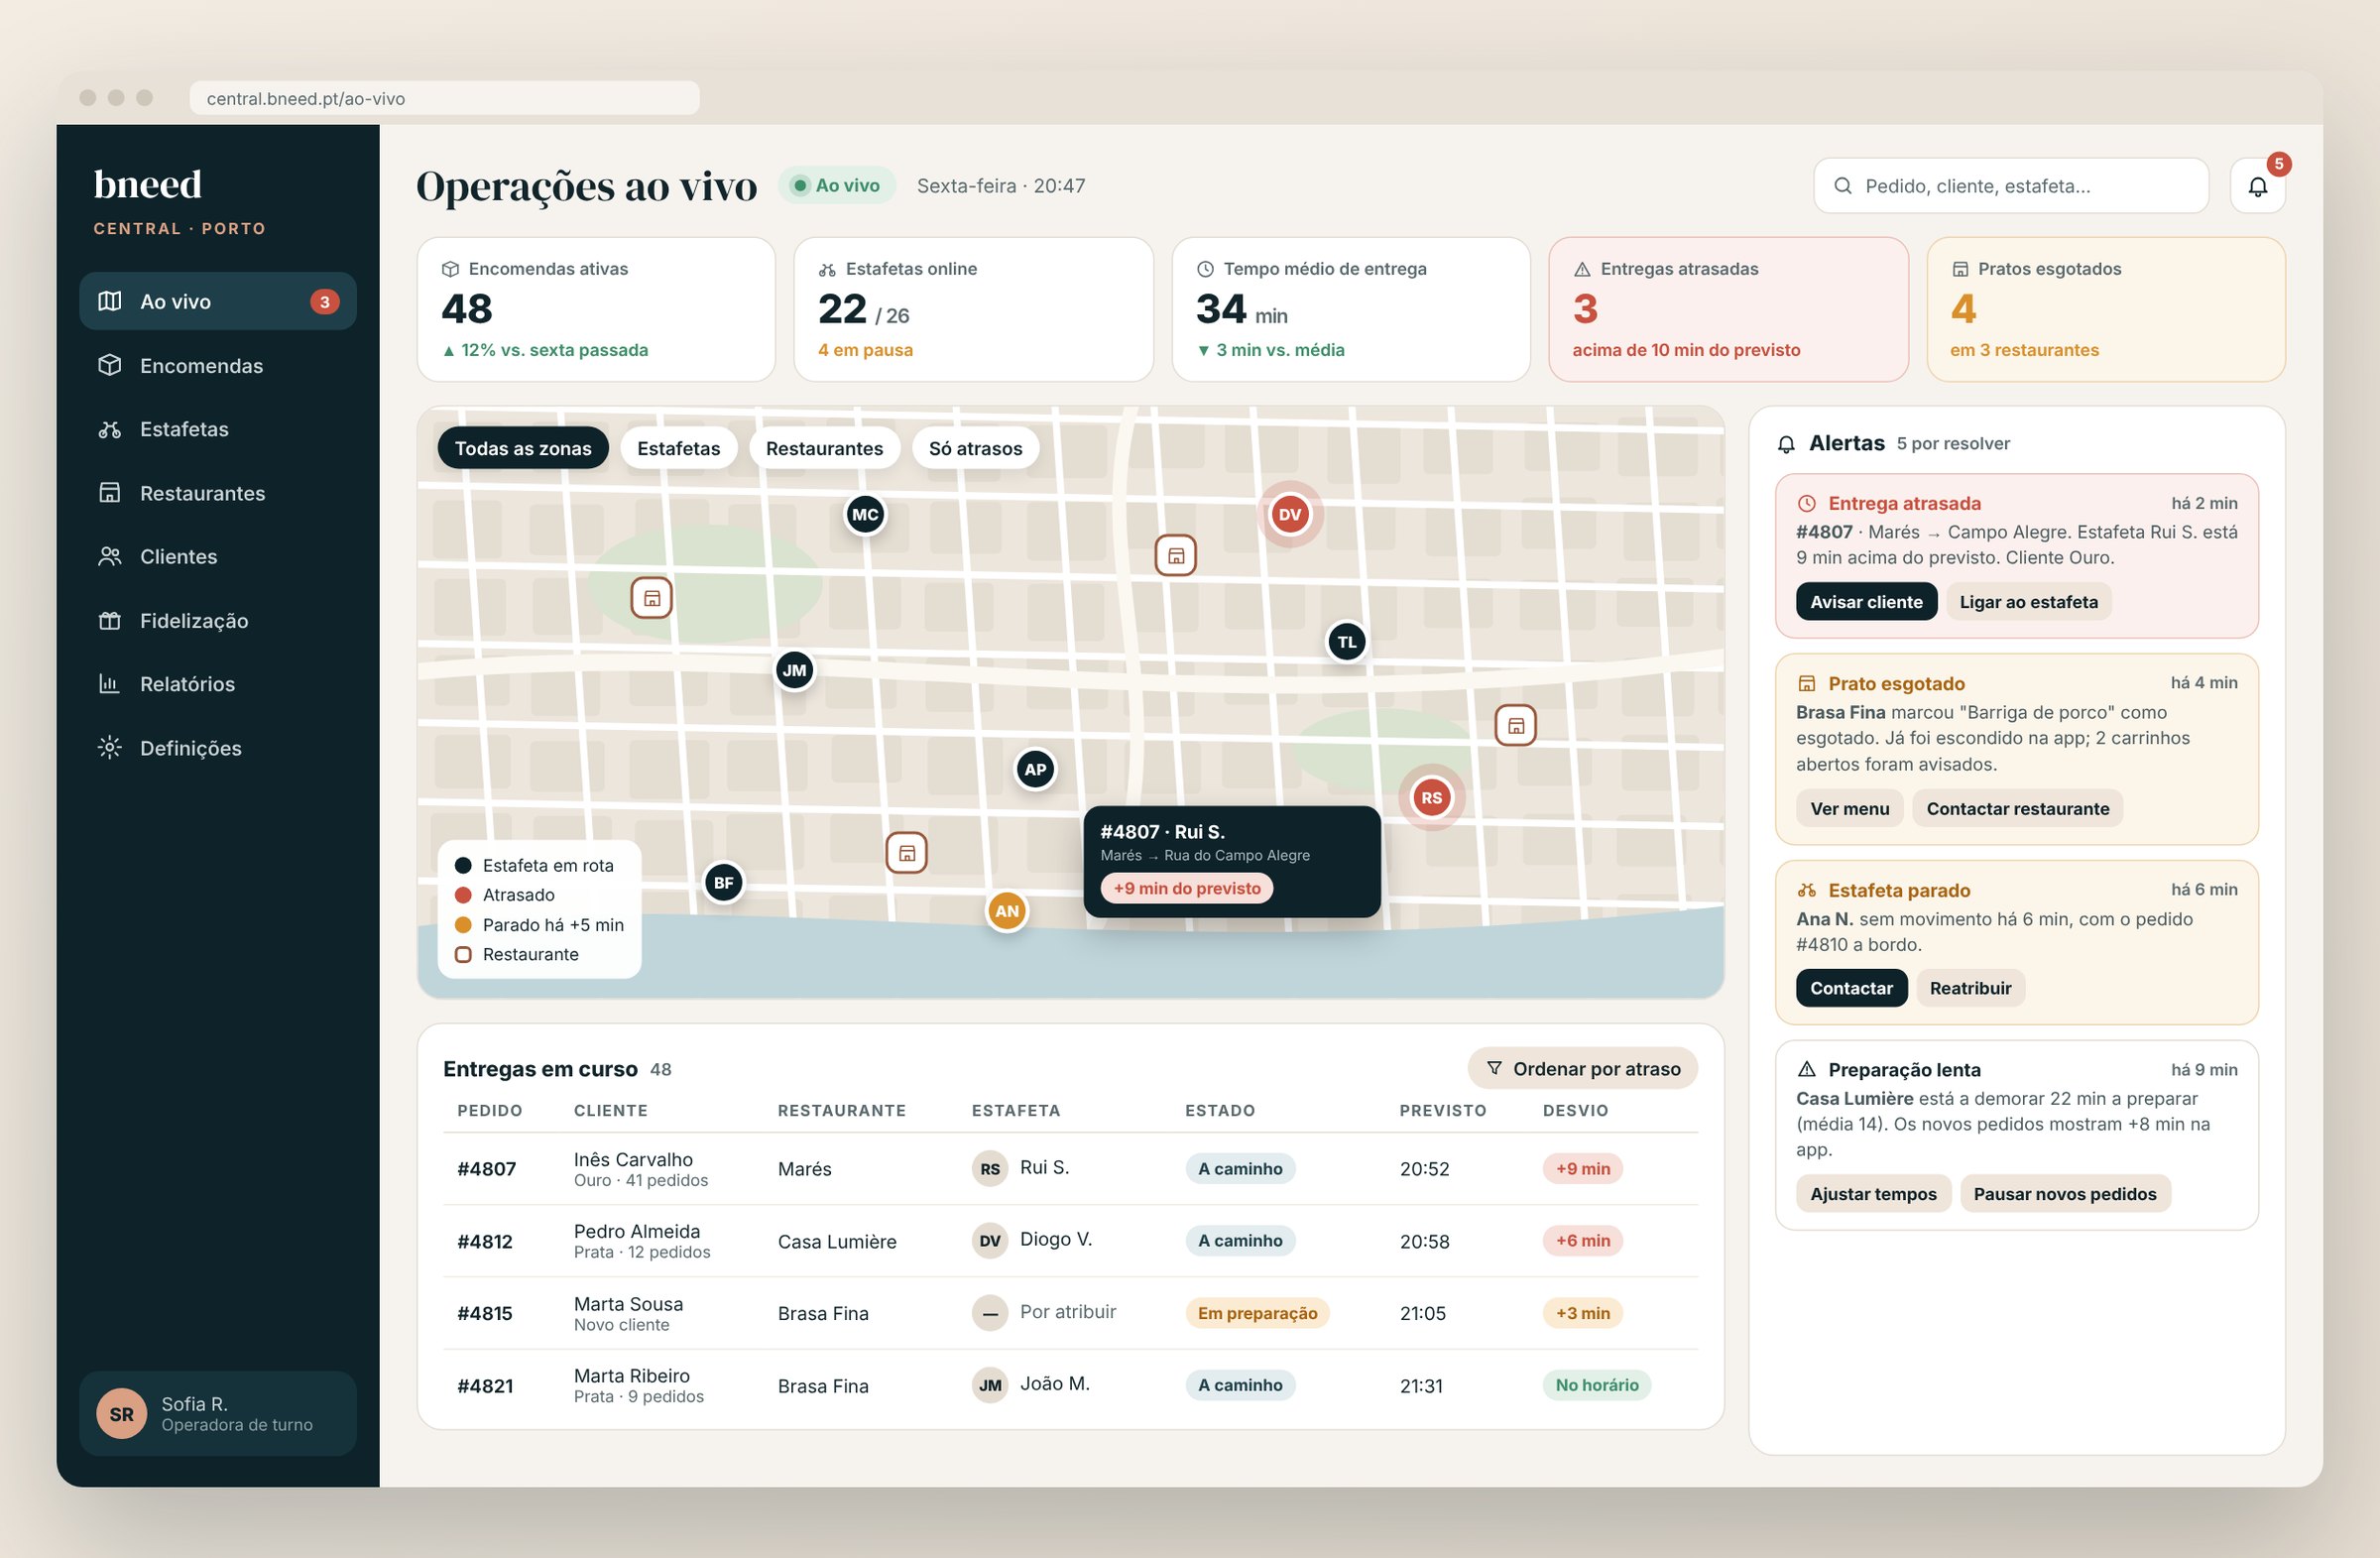
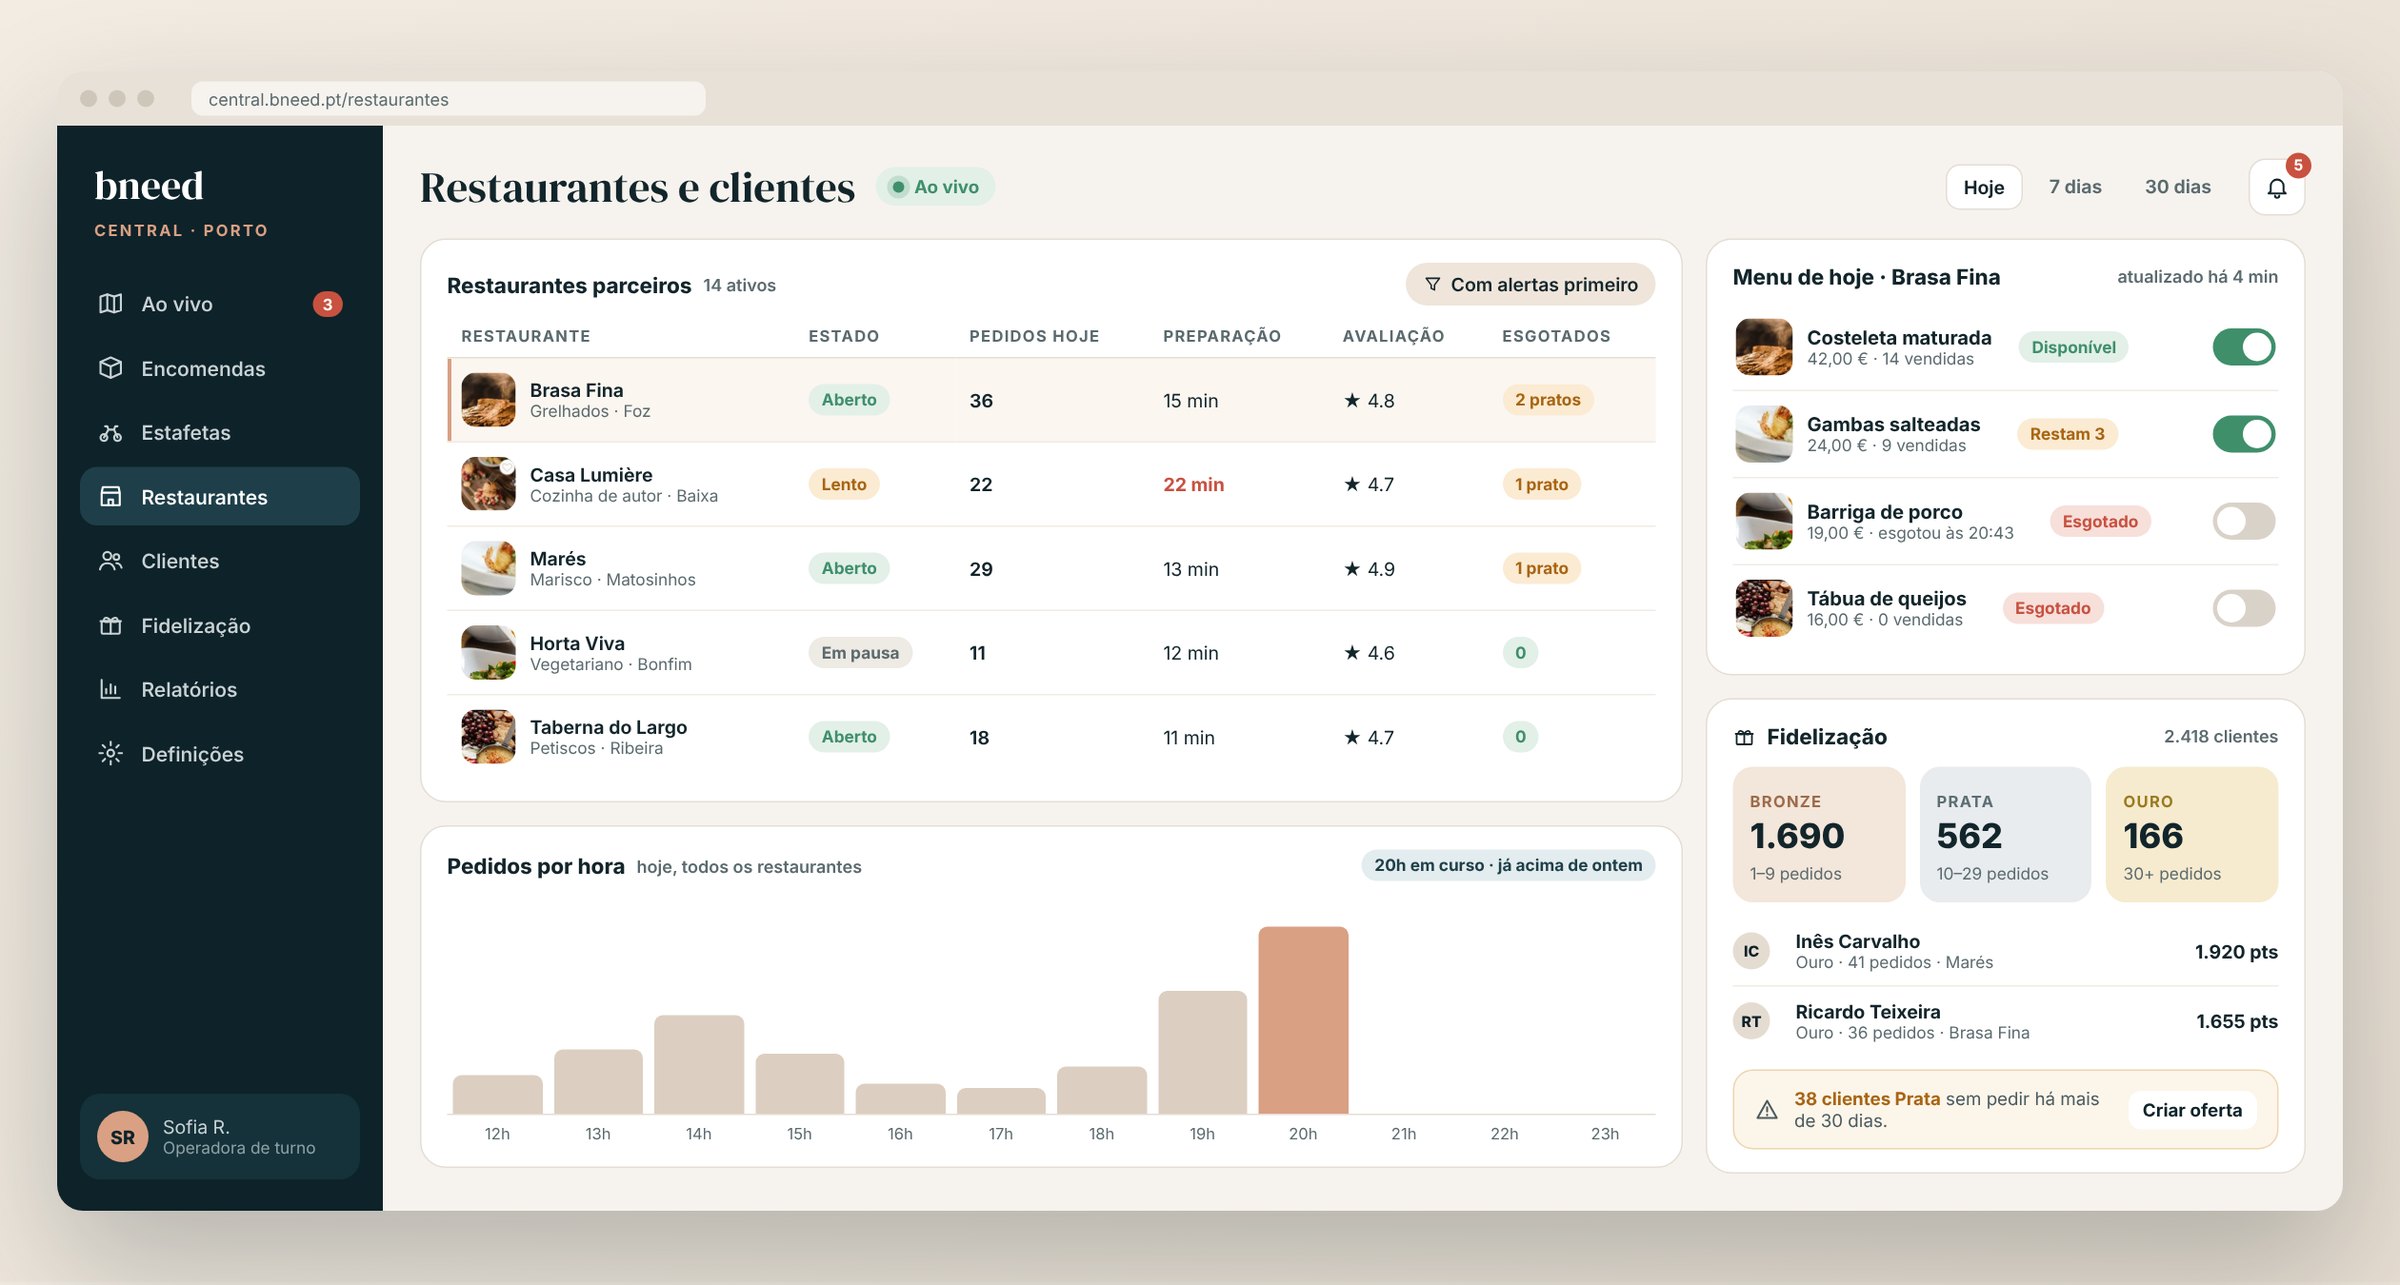
The dashboard screens were recreated for this portfolio from the original project, because no screenshots of the final version exist. All data is fictional.
Exceptions first
Normal indicators stay neutral. Only delays and sold-out dishes get colour, so attention goes where it's needed.
Alerts with an action
Each alert says what happened, to whom, and what the next step is: notify the customer, call the courier, reassign or pause orders.
Sort by delay
The deliveries table shows the most delayed first, not the oldest.
Actionable loyalty
Beyond counting customers per tier, the dashboard shows who's at risk of no longer ordering and lets the team create an offer from there.
What I learned
- In a multi-sided product, the design starts with the shared data, not the screens.
- In an operations dashboard, showing less is the hardest and most important decision.
- Revisiting an old project with today's criteria (contrast, context, navigation) is a good way to measure how much I've grown.